
Today the students and I have played around with visualizations in Google Fusion and Manyeyes. Scott has exported data from the ELMCIP Electronic Literature Knowledge Base, so we’ve been making pie charts and timelines and maps and so forth.
Here are the files if you’d like to experiment:
In Google Fusion, you select a kind of visualization from the “Visualize” pulldown menu. This dataset doesn’t have location data so you can’t make maps, I’m afraid, because that information is tied to authors, not to individual works.
Here’s a timeline of works in the knowledge base that are tagged “hypertext” that Scott put together in Google Fusion:
And here’s a word cloud made from titles of works in the knowledge base, created in Manyeyes:

I hadn’t realised how many of the titles include statements about what genre the work belongs to: book, poem, novel, generator, statement, hypertext, project, letter. I suppose many titles in print literature do the same, come to think of it.
Obviously the dataset comes with biases – it doesn’t (and may never be able to) contain complete information about all electronic literature ever published, and there’s a lot of Young-Hae Chang in there because a student did a project on that group last semester – I actually removed the words “Samsung” and “Korean” from the word cloud because they dwarfed everything else. But it’s interesting to see how it’s relatively easy to do simple visualisations from the data we do have – and to think about what kinds of visualisations we would like to do, and how that might help our research.
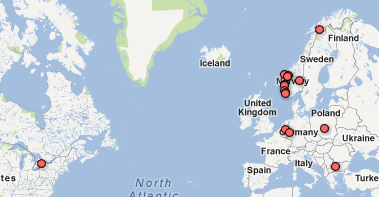
In class, we also made a simple map of where the students in this class come from – all over Norway, as you can see, and some other interesting places too. This is very easy to do, you just open a new table, add some place names or addresses to the “location” column and hit “visualize”. We mostly followed this tutorial. You could also upload your own address book, I assume, or other tables with address or location information.
In a way this is just dabbling, and obviously we should all learn a lot more about data visualization to use it properly. But I’m a big believer in having a go at things even before you’re quite sure how to do it – and I think having students who at least have some idea of how they could go about visualizing data is an excellent start. I think it’s also easier to think critically about the biases and sources of the data when we’ve played with the tools ourselves. Maybe some of them will come up with ways of using visualizations usefully in their bachelor theses, or next semester in another paper, or eventually in their MA theses.


